On this page
- What compound interest actually is
- How to use this calculator and read the numbers
- The mathematics behind lump sums and monthly contributions
- Why time matters more than chasing a higher rate
- What regular contributions do and when the crossover point arrives
- Compounding frequency, nominal rates, and effective annual yield (APY)
- Mental shortcuts: the Rule of 72, Rule of 114, and where they break down
- Three worked real-world scenarios you can test above
- What sits between a projection and spendable wealth
- When compounding works in reverse: savings APY versus debt APR
- Reading your result sensibly and avoiding planning mistakes
- Sources
What compound interest actually is
Simple interest pays you only on the money you originally put in. Compound interest pays you on the money you put in plus every unit of interest that money has already earned. That single mechanical difference is the reason a modest deposit left undisturbed for twenty-five or thirty years can finish worth several times what you contributed out of pocket.
Picture two accounts, each opened with 1,000 and never touched again. One pays simple interest at 8 percent per year; the other pays 8 percent compounded annually. The simple-interest account credits exactly 80 every year without exception, so after thirty years you walk away with 3,400 (your 1,000 principal plus thirty payments of 80). The compound-interest account also earns 80 in year one, bringing the balance to 1,080. In year two, however, 8 percent is calculated on 1,080 rather than 1,000, producing 86.40. By year ten the annual interest credit has risen to 159.92; by year twenty it reaches 345.23; and at the end of year thirty the account holds 10,062.66 (or 10,935.73 if compounded monthly). Same starting deposit, same headline rate, same thirty-year wait — yet reinvesting the interest adds more than 6,600 above simple interest alone.
In real financial life, compounding only happens when earnings stay inside the engine. A corporate bond or fixed deposit that transfers its interest payout into your everyday spending account every quarter is giving you simple interest, unless you deliberately reinvest those payouts yourself. By contrast, a cumulative savings account, a money market fund that automatically reinvests distributions, a rolled-over Treasury bill ladder, or an equity index fund with dividend reinvestment turned on keeps past gains working alongside your original capital. That is why personal finance educators come back to the same two rules regardless of income level or country: start as early as your budget allows, and avoid skimming off the growth before it has had time to build scale.
How to use this calculator and read the numbers
Because compound interest algebra behaves identically whether you count in Ghanaian cedis, Nigerian naira, Kenyan shillings, South African rand, pounds, euros, or US dollars, the form above stays intentionally currency-neutral. You only need to keep all inputs in the same currency unit and understand what each field assumes behind the scenes.
- Starting amount: Enter the cash lump sum you already have ready to invest on day one. If you are starting from zero and building purely from monthly paychecks, enter
0here and fill in the monthly contribution box instead. - Annual interest rate (%): Enter the expected yearly return before tax. If your bank or fund manager quotes a nominal rate (for instance, 10 percent per annum paid quarterly), pair that rate with the matching frequency dropdown. If the institution already quotes an Effective Annual Rate (EAR) or Annual Percentage Yield (APY), choose Annually in the frequency selector so you do not compound an already-compounded figure twice.
- Time horizon (years): Whole years between 1 and 100. Match this to when you actually intend to spend the money — five years for a house deposit, fifteen years for secondary or university fees, thirty years for retirement.
- Compounding frequency: Controls how often earned interest is folded back into principal (annually, twice a year, quarterly, monthly, or daily). Most retail savings accounts and money market funds credit monthly; fixed deposits and government bills often settle quarterly or semi-annually.
- Monthly contribution (optional): Following standard financial planning convention (the same ordinary-annuity convention used by the SEC Investor.gov calculator), each monthly deposit is added on the last day of the month. That means a deposit added at the end of month one earns zero interest during month one itself, and then compounds across every month from month two onward.
Once you press Calculate growth, the results panel separates four numbers that are easy to blur together when looking at a headline pot. Final balance is the full nominal account value at the end of your horizon. Total paid in adds your starting lump sum to every monthly deposit you made along the way — the raw cash sacrifice from your pocket. Interest earned subtracts total paid in from the final balance, isolating how much money the investment generated on its own. Finally, Return on investment (ROI) expresses total interest earned as a percentage of total cash paid in: ROI = (Interest Earned ÷ Total Paid In) × 100. Below the summary cards, the year-by-year schedule tracks the first thirty years row by row so you can pinpoint the exact year your accumulated interest overtakes your own deposits.
The mathematics behind lump sums and monthly contributions
If you deposit a single lump sum once and never add another coin, future value is governed by one classic equation:
A = P × (1 + r ÷ n)^(n × t)
- P is your starting principal (for example, 5,000).
- r is the stated annual interest rate written as a decimal (8 percent becomes 0.08).
- n is the number of compounding periods per year (1 for annual, 2 for semi-annual, 4 for quarterly, 12 for monthly, 365 for daily).
- t is the number of years the money stays invested.
- A is the future value at the end of year t.
What that equation is doing in practice is multiplying your money by a small growth factor once for every compounding period. With monthly compounding at 8 percent over twenty years, each month multiplies the balance by 1 + (0.08 ÷ 12) = 1.006667, and it performs that multiplication 240 times in a row. Because each step multiplies the new, slightly larger balance rather than the original principal, growth curves upward instead of marching in a straight line.
Most real savers, however, do not just lock away a single lump sum — they also add money each month while the account is compounding. When monthly contributions (PMT) are added at the end of every month, the total future value combines two parts: the compounded lump sum plus the future value of an ordinary annuity. Notice a subtle mathematical detail that trips up many spreadsheet users: what happens if your account compounds quarterly (n = 4) or annually (n = 1), yet you deposit money every month? Simply dividing the annual rate by 12 would ignore your chosen compounding frequency. To handle every combination cleanly, this calculator first converts your stated rate and compounding frequency into an exact equivalent effective monthly rate (i_m):
i_m = (1 + r ÷ n)^(n ÷ 12) - 1
When you select monthly compounding (n = 12), the exponent 12 ÷ 12 equals 1, so i_m simplifies directly to r ÷ 12. When you select quarterly compounding (n = 4) at 10 percent, i_m = (1 + 0.10 ÷ 4)^(4 ÷ 12) - 1 = (1.025)^(1/3) - 1 ≈ 0.008265 (0.8265 percent per month), ensuring that twelve monthly steps produce the exact 2.50 percent quarterly rate four times a year. Across M = 12 × t total months, the closed-form combined equation is:
Future Value = P × (1 + i_m)^M + PMT × [((1 + i_m)^M - 1) ÷ i_m]
Inside the script on this page, the calculator steps forward month by month from month 1 to month M using balance = balance × (1 + i_m) + PMT, recording each twelfth month for the annual schedule. That iterative loop produces the exact same penny-for-penny result as the closed-form annuity formula above while letting you inspect every year along the path.
Why time matters more than chasing a higher rate
Beginners almost always focus on the interest rate box first. Finding 11 percent instead of 8 percent feels like the decisive victory, whereas waiting two or three years to "get settled financially" before opening an investment account feels harmless. When you run the numbers, the hierarchy is nearly always the reverse: time in the market carries an exponential exponent (n × t), while the rate sits inside the base.
Compare two lump-sum investors first. Investor A places 5,000 into an account earning 8 percent compounded monthly and leaves it alone for thirty years, finishing with 54,678.65. Investor B finds a much higher 12 percent return (also compounded monthly) on the same 5,000, but starts ten years later and only compounds for twenty years, finishing with 54,462.77. Even a full four-percentage-point rate advantage — fifty percent higher annual yield — barely catches up to a ten-year head start, because half of all cumulative gains in a multi-decade plan arrive right at the back end.
The gap becomes even more striking when people save out of monthly income. Consider three savers of the same age who all earn 8 percent nominal compounded monthly toward retirement at age 60, contributing 150 at the end of each active saving month:
| Saver Profile (8% Compounded Monthly) | Active Deposit Window | Total Cash Paid In | Interest Earned | Balance at Age 60 |
|---|---|---|---|---|
| Early Ten-Year Saver (stops adding at 33) | Ages 23 to 33 (10 yrs) | 18,000.00 | 218,252.96 | 236,252.96 |
| Late Catch-Up Saver (starts at 33) | Ages 33 to 60 (27 yrs) | 48,600.00 | 122,607.09 | 171,207.09 |
| Consistent Career Saver (never stops) | Ages 23 to 60 (37 yrs) | 66,600.00 | 340,860.04 | 407,460.04 |
Read the first two rows carefully. The Early Ten-Year Saver contributes 150 a month for ten years — putting in just 18,000 out of pocket — reaches 27,441.91 at age 33, and never deposits another unit of currency for the next twenty-seven years, merely leaving the balance invested. The Late Catch-Up Saver waits until age 33 to begin, then dutifully deposits 150 every single month for twenty-seven straight years, contributing 48,600 in cash (nearly triple what the early starter paid in). Yet at age 60, the early starter sits on 236,252.96 while the late starter finishes with 171,207.09 — trailing by more than 65,000 despite contributing 30,600 more from salary. For the late starter merely to tie the early starter's age-60 balance over those twenty-seven years, their monthly deposit would have to jump from 150 to 206.99 per month (67,064.43 total cash paid in).
The practical takeaway. Waiting until you can afford a "respectable" monthly amount is usually an expensive mistake. Starting now with 40 or 50 a month builds both the behavioural habit and the early-decade seed capital that later salary increases cannot cheaply replicate.
What regular contributions do and when the crossover point arrives
When you save a fixed sum every month, the early years almost always feel underwhelming. That emotional flatness is normal, and understanding why it happens prevents people from abandoning good plans in year three or four.
Take a straightforward thirty-year plan: starting balance of 0, monthly contribution of 100, and an 8 percent nominal rate compounded monthly. After twelve months you have contributed 1,200 of your own cash and earned just 44.99 in interest — barely 3.6 percent of your balance. At the five-year mark you have paid in 6,000 and earned 1,347.69 in interest: encouraging, yet more than four-fifths of your account still came straight from your own sweat. Around year ten to eleven, however, a quiet first milestone occurs: the new interest generated inside a single twelve-month stretch surpasses the 1,200 you deposit that year. Then, during year sixteen, the cumulative crossover arrives — total interest earned (19,520.91) permanently overtakes total cash paid in (19,200.00).
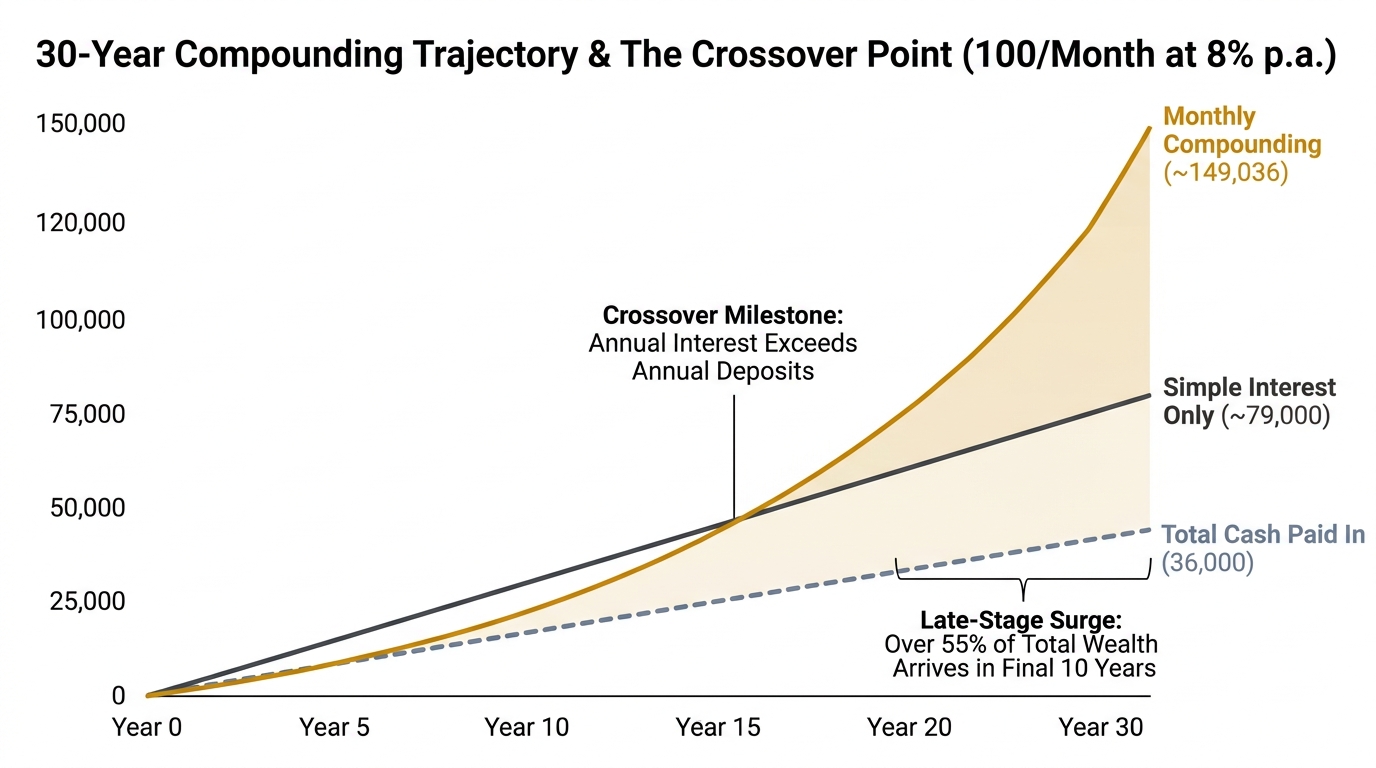
Look at how the numbers accelerate across five-year checkpoints when you run that exact 100-per-month plan in the calculator above:
| Checkpoint | Total Cash Paid In | Cumulative Interest | Account Balance | Interest Share of Pot |
|---|---|---|---|---|
| Year 1 | 1,200.00 | 44.99 | 1,244.99 | 3.6% |
| Year 5 | 6,000.00 | 1,347.69 | 7,347.69 | 18.3% |
| Year 10 | 12,000.00 | 6,294.60 | 18,294.60 | 34.4% |
| Year 16 (Cumulative Crossover) | 19,200.00 | 19,520.91 | 38,720.91 | 50.4% |
| Year 20 | 24,000.00 | 34,902.04 | 58,902.04 | 59.3% |
| Year 25 | 30,000.00 | 65,102.64 | 95,102.64 | 68.5% |
| Year 30 | 36,000.00 | 113,035.94 | 149,035.94 | 75.8% |
Between year twenty and year thirty, you only deposit 12,000 of fresh cash, yet your account jumps from 58,902.04 to 149,035.94 — an increase of 90,133.90 in ten years. Raiding a long-term pension or investment fund every five years to pay for a car upgrade or a wedding resets the clock back to Year 1 repeatedly, trapping your money permanently in the flat left-hand side of Figure 1 where your own salary has to do 80 to 95 percent of the work.
Compounding frequency, nominal rates, and effective annual yield (APY)
The frequency dropdown lets you test annual, semi-annual, quarterly, monthly, and daily compounding. People often assume daily compounding is a magic multiplier compared with annual or monthly crediting. Looking at exact numbers puts that belief in proper proportion.
Suppose you invest a 10,000 lump sum for twenty years with zero monthly additions. Here is how compounding frequency changes both the true Effective Annual Rate — computed as EAR = (1 + r ÷ n)^n - 1 — and the twenty-year ending balance at a moderate 8 percent stated rate versus a higher 12 percent stated rate:
| Compounding Frequency | 8% Stated → EAR | 20-Yr Pot on 10,000 (8%) | 12% Stated → EAR | 20-Yr Pot on 10,000 (12%) |
|---|---|---|---|---|
| Annually (n = 1) | 8.000% | 46,609.57 | 12.000% | 96,462.93 |
| Twice a year (n = 2) | 8.160% | 48,010.21 | 12.360% | 102,857.18 |
| Quarterly (n = 4) | 8.243% | 48,754.39 | 12.551% | 106,408.91 |
| Monthly (n = 12) | 8.300% | 49,268.03 | 12.683% | 108,925.54 |
| Daily (n = 365) | 8.328% | 49,521.64 | 12.747% | 110,188.29 |
Two practical patterns jump out of that table. First, most of the gain from more frequent compounding happens simply moving from annual to quarterly or monthly; moving from monthly to daily adds just 0.028 percentage points to the effective yield at 8 percent (253.61 extra over twenty years on a 10,000 deposit). Never choose an unfamiliar digital savings platform over a regulated institution merely because its marketing banner promises "daily compounding" — a tiny 0.25 percent account maintenance fee wipes out the daily-over-monthly advantage several times over.
Second, notice that intra-year compounding matters noticeably more when nominal interest rates are high. In markets where Treasury bills or fixed deposits pay 12 to 18 percent nominal, moving from annual to monthly or quarterly rollover adds roughly 0.68 to 1.49 percentage points of extra annualised yield. When comparing two competing products, always check whether the advertised rate is a nominal rate or an Effective Annual Rate / APY. An account quoting "12.00% APY" and an account quoting "12.00% nominal compounded monthly" are not paying the same return: the second one actually yields 12.683 percent per year.
Mental shortcuts: the Rule of 72, Rule of 114, and where they break down
You will not always have a browser open when evaluating a fixed deposit rate at a bank counter or listening to someone pitch a target return. A reliable mental shortcut lets you sanity-check any rate in about three seconds before you touch a form.
The best-known shortcut is the Rule of 72: divide 72 by the annual percentage return to estimate how many years a single lump sum needs to double. At 6 percent per year, 72 ÷ 6 gives roughly 12 years. At 9 percent, 72 ÷ 9 gives roughly 8 years. Two sibling shortcuts work on the same logarithmic principle when you want longer multiples: divide 114 by the annual rate to estimate how many years it takes your money to triple, or divide 144 by the annual rate to estimate how long it takes to quadruple (which is simply two back-to-back doublings).
| Annual rate | Rule of 72 estimate | Exact doubling (annual) | Exact doubling (monthly) | Practical accuracy |
|---|---|---|---|---|
| 4% | 18.00 yrs | 17.67 yrs | 17.36 yrs | Within 4 months of annual compounding |
| 6% | 12.00 yrs | 11.90 yrs | 11.58 yrs | Within 5 weeks of annual compounding |
| 8% | 9.00 yrs | 9.01 yrs | 8.69 yrs | Sweet spot — virtually exact on annual rates |
| 10% | 7.20 yrs | 7.27 yrs | 6.96 yrs | Within 1 month of annual compounding |
| 12% | 6.00 yrs | 6.12 yrs | 5.81 yrs | Within 6 weeks on both conventions |
| 15% | 4.80 yrs | 4.96 yrs | 4.65 yrs | Splits the gap between annual and monthly |
| 20% | 3.60 yrs | 3.80 yrs | 3.49 yrs | Starts understating annual doubling by ~2.4 months |
| 24% | 3.00 yrs | 3.22 yrs | 2.92 yrs | Closer to monthly debt APR than annual lump sums |
Where do these mental rules fall apart? First, they drift at extreme interest rates: below 2 percent (where dividing 69.3 by the rate is sharper) and above 20 percent on annual compounding (where 72 understates the time needed because discrete annual steps lag continuous growth). Second, and far more important for everyday savers, the Rule of 72 ignores ongoing monthly contributions completely. If you open an account with 2,000 at 8 percent and add 200 every month, your account balance passes 4,000 inside ten months — not nine years — because fresh deposits are doing the heavy lifting. Whenever regular savings are part of your plan, mental division cannot tell you where you will land; you need the month-by-month schedule above.
One quiet bonus of the Rule of 72 is that it works just as well on inflation. If living costs in your city are rising at 6 percent a year, 72 ÷ 6 = 12 tells you that the purchasing power of idle cash sitting in a zero-interest current account will be cut in half in roughly twelve years. At 9 percent inflation, uninvested cash loses half its buying power in about eight years.
Three worked real-world scenarios you can test above
Abstract percentages become much easier to judge when you attach them to concrete household decisions. Every figure in the three examples below comes straight from the calculator engine at the top of this page, so you can type the exact inputs into the form and inspect the full year-by-year table yourself.
Medium-term reserve: 6-year Treasury bill or money market ladder
Inputs to enter: Starting amount 2,500 · Monthly contribution 200 · Annual rate 11% · Compounding Quarterly · Horizon 6 years.
Suppose you are building a house-deposit or business-equipment fund in a regulated money market or 91-day Treasury bill programme that rolls over quarterly at an average nominal rate of 11 percent. Because interest compounds four times a year while you add 200 every month, the calculator converts 11 percent quarterly into an equivalent monthly rate of 0.90839 percent. Over six years you put in 16,900.00 of your own money (2,500 upfront plus 72 monthly deposits of 200). Compounding adds 8,097.42 in interest, taking your final balance to 24,997.42 — a 47.9% return over total cash paid in. Notice that on a six-year horizon, roughly two-thirds of the pot still comes from disciplined monthly saving, while interest contributes a welcome one-third boost.
Long-term retirement core: 25-year career accumulation
Inputs to enter: Starting amount 10,000 · Monthly contribution 300 · Annual rate 8.5% · Compounding Monthly · Horizon 25 years.
Here a mid-career professional rolls an existing 10,000 pension or brokerage balance into a diversified global portfolio and contributes 300 at the end of every month for twenty-five years, earning an average annualised return of 8.5 percent compounded monthly. Total cash contributed across the quarter-century is exactly 100,000.00 (10,000 starting capital plus 300 × 300 months). By year twenty-five, however, the projected balance reaches 392,721.62, meaning 292,721.62 — nearly three-quarters of the entire retirement pot, or a 292.7% return on money paid in — comes from compounded growth rather than payroll deductions.
Reverse goal-seeking: funding a 60,000 university target in 15 years
Inputs to enter: Starting amount 3,000 · Monthly contribution 163 · Annual rate 7% · Compounding Monthly · Horizon 15 years.
Parents setting aside money for a child's university fees often know the target figure and the deadline first, then need to solve backwards for the monthly contribution. Starting with 3,000 in an education fund earning a cautious 7 percent net return compounded monthly over 15 years, a first guess of 150 per month lands at 56,091.18 — about 3,909 short of 60,000. Nudging the monthly contribution up to 163 lifts the 15-year balance to 60,211.69, built from 32,340.00 paid in and 27,871.69 in compounded interest (an 86.2% return over cash contributed). Running that two-minute test today reveals a manageable 13-per-month adjustment while fifteen years of runway remain, instead of a painful shortfall two years before enrolment.
What sits between a projection and spendable wealth
The future balance displayed by any compound interest calculator is a gross nominal projection. It is mathematically exact for the inputs you type, yet it is not the same thing as the purchasing power you will eventually hold in your hand. Four real-world forces sit between the headline projection and what you can actually spend.
1. Management fees and platform costs compound in reverse
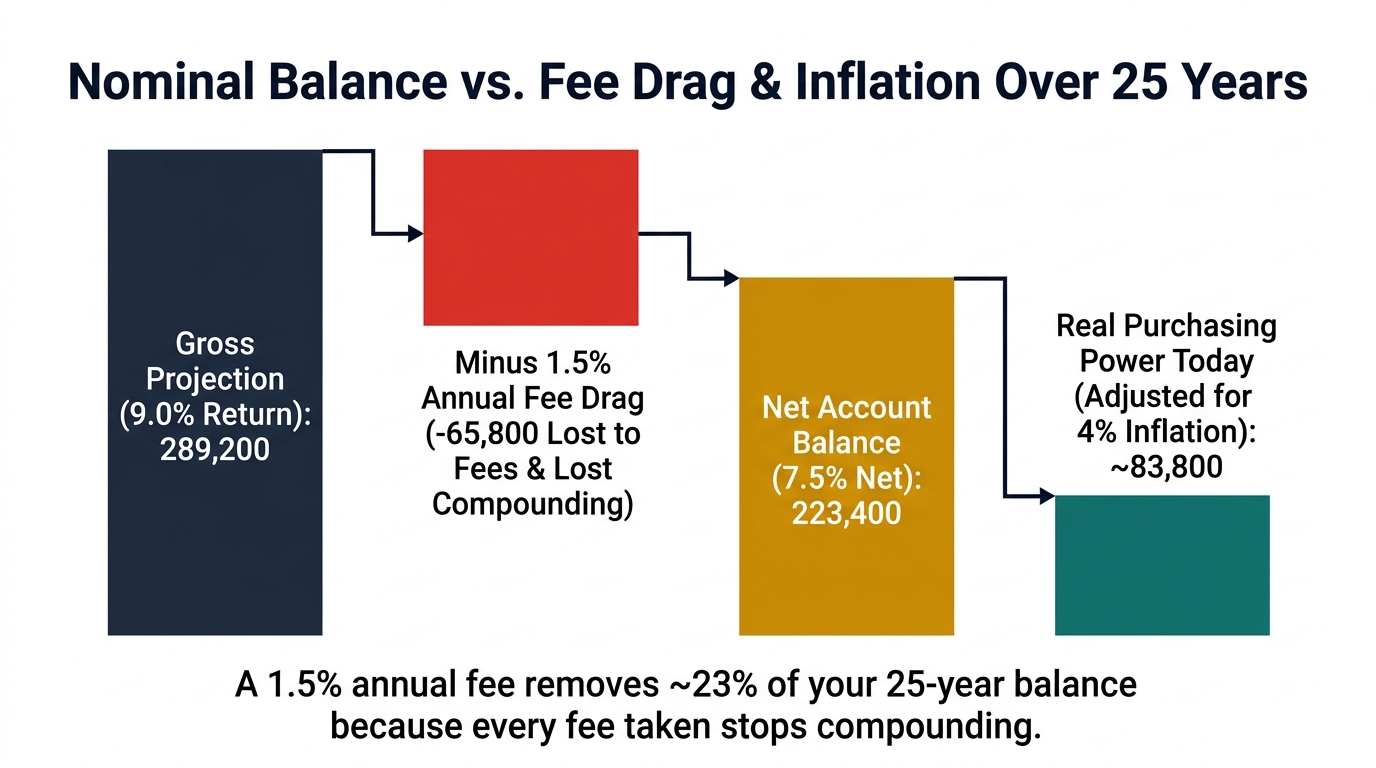
A 1.5 percent annual fund fee sounds tiny when quoted next to a 9 percent expected return. Many investors mistakenly assume a 1.5 percent fee trims 1.5 percent off their final pot. It does not: it trims 1.5 percent off the entire balance every single year, and you also lose all the future compounding that those deducted fee payments would have generated over the remaining decades. Look at what happens in this calculator when you invest 5,000 upfront plus 200 a month for 25 years (65,000.00 total cash paid in, compounded monthly) across different fee and inflation assumptions:
| Scenario (5,000 start + 200/mo for 25 yrs) | Rate entered | Final balance | Interest earned | Wealth lost vs. gross |
|---|---|---|---|---|
| Gross market return (zero fees, before inflation) | 9.00% | 271,266.46 | 206,266.46 | — |
| Low-cost index or direct bond account (0.25% fee) | 8.75% | 259,319.25 | 194,319.25 | 11,947.21 (4.4%) |
| Typical retail active fund (1.50% annual fee) | 7.50% | 207,866.58 | 142,866.58 | 63,399.88 (23.4%) |
| High-fee wrapped / advisory product (2.50% fee) | 6.50% | 175,048.29 | 110,048.29 | 96,218.17 (35.5%) |
| Real buying power (7.50% net return at 4.00% inflation) | 3.37% | 105,487.41 | 40,487.41 | Measured in today's money |
Read the third and fourth rows closely. Across twenty-five years, a 1.50 percent annual fee consumes 63,399.88 — almost equal to the entire 65,000.00 you contributed out of your own salary. A 2.50 percent layered fee swallows 96,218.17, or more than a third of the gross final balance. Whenever you model a mutual fund, unit trust, or pension plan, subtract its Total Expense Ratio (TER) and platform fee from your expected gross rate before clicking Calculate.
2. Inflation and the exact Fisher real-rate adjustment
Rising prices shrink what each currency unit buys over time. If inflation averages 5 percent per year, goods that cost 100 today will cost roughly 432 in thirty years (100 × 1.05 raised to the power 30). People often estimate their real return by simply subtracting inflation from their interest rate — say, 7.5 percent minus 4.0 percent equals 3.5 percent. That mental subtraction is fine for a quick check at low rates, but economists use the exact Fisher equation, which becomes noticeably more accurate when inflation is elevated:
Exact inflation-adjusted rate (Fisher formula): Real Rate = [(1 + Net Nominal Rate) ÷ (1 + Inflation Rate)] - 1. For a 7.5% net return during 4.0% inflation: (1.075 ÷ 1.04) - 1 = 0.03365, or 3.37%. In a higher-inflation economy where Treasury bills yield 16% and inflation runs at 11%, simple subtraction suggests a 5.00% real gain, whereas the Fisher formula gives (1.16 ÷ 1.11) - 1 = 4.50%.
Note one subtlety when you run a real-rate projection with monthly contributions (such as the 3.37 percent bottom row in the table above): entering a real rate assumes your monthly deposit also rises each year in step with inflation, so that "200 in today's money" remains 200 of constant purchasing power every month. If your cash contribution stays frozen at a flat nominal 200 while prices climb every year, your real purchasing power at the end will be somewhat lower than the constant-purchasing-power line.
3. Annual withholding tax versus deferred exit tax
Tax timing changes the speed of compounding, not merely the final slice taken at the end. In many jurisdictions, bank deposit interest and corporate bond coupons suffer a withholding tax (often 10 to 20 percent) deducted automatically each time interest is credited. If an account pays 10 percent nominal and 15 percent tax is withheld every year, your capital actually compounds at 8.5 percent from year one onward. By contrast, a tax-sheltered retirement account, ISA, Roth-style wrapper, or accumulating fund taxed only on capital gains when you eventually sell lets the full 10 percent compound uninterrupted for decades before tax is settled once at the end. On a 10,000 lump sum over 25 years at 10 percent annual compounding, paying 15 percent tax every year leaves 76,868, whereas compounding untaxed at 10 percent to 108,347 and paying a 15 percent tax on the 98,347 gain at withdrawal leaves 93,595 — nearly 16,700 more from identical pre-tax returns and the same tax rate, purely because the tax money stayed invested in the meantime.
4. Return volatility and sequence-of-returns risk
Fixed deposits and government bonds held to maturity pay a contractual rate on schedule. Equity markets, real estate funds, and balanced portfolios do not. Saying a stock index averaged 8.5 percent annualised over twenty-five years means it might have gained 26 percent one year, dropped 18 percent the next, sat flat for three years, and surged 31 percent after that. Two practical consequences follow. First, an arithmetic average is never the same as a compounded return: an account that gains 50 percent in year one (1,000 to 1,500) and loses 50 percent in year two (1,500 down to 750) has an arithmetic average return of 0 percent, yet its actual compounded return is minus 13.4 percent per year because losses act on a larger base. Second, once you approach the date when you actually need to spend the money, a sharp market drop in the final two years does far more damage than the same drop in year three. Moving cash you will need within three to five years out of volatile equities and into predictable short-term instruments protects accumulated compounding from bad timing.
When compounding works in reverse: savings APY versus debt APR
The exact exponential equation that quietly builds long-term wealth works just as relentlessly against you when you are the borrower instead of the lender. Banks, credit card issuers, buy-now-pay-later providers, and micro-lenders apply compound maths to unpaid balances — often at rates triple what savers can earn on safe deposits, and frequently using daily compounding.
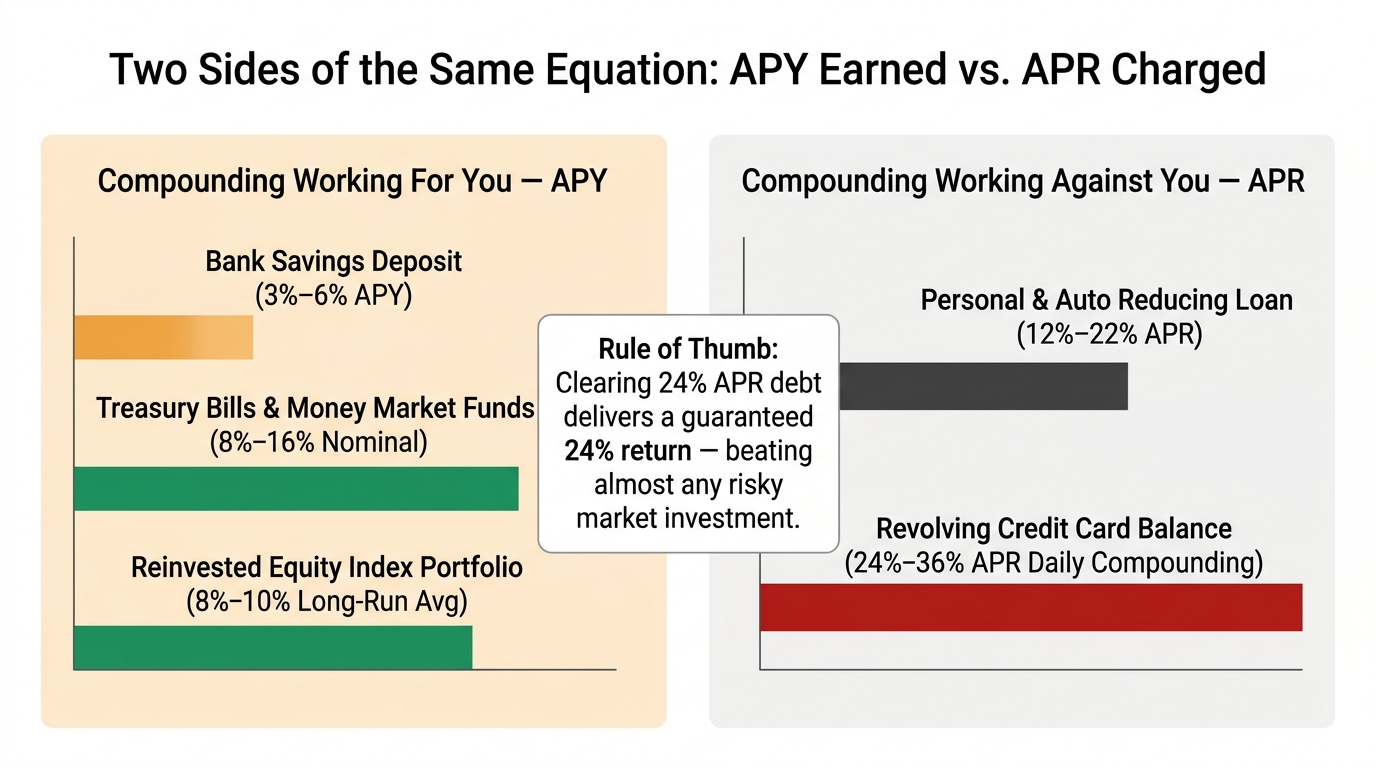
Consider a household holding 3,000 in a savings account paying 6 percent APY while simultaneously carrying a 3,000 revolving credit card balance at 28 percent nominal APR compounded daily. Over twelve months, the savings account earns 180 before tax. Meanwhile, a 28 percent nominal rate compounded daily equals an effective annual cost of 32.30 percent — roughly 969 of interest charges if left unpaid, leaving the household 789 poorer after a year despite feeling disciplined for keeping money "in savings."
Watch out as well for how consumer lenders quote loan rates. Regulated mortgages and standard bank loans usually quote an Annual Percentage Rate (APR) on a reducing balance, meaning each monthly repayment shrinks the principal on which next month's interest is charged (you can model those schedules directly in our Loan Calculator and Debt Payoff Calculator). Some salary-advance schemes, appliance hire-purchase contracts, and informal lenders instead quote a flat monthly or flat annual rate charged on the original borrowed sum for the whole term even as you pay it back. A "15% flat annual rate" repaid in twelve equal monthly instalments actually costs roughly 26.6% to 27.3% APR on a true reducing-balance basis — almost double the headline number.
When deciding whether your next spare 100 a month should go into investments or toward clearing debt, a sensible order of operations for most households looks like this:
- Capture any guaranteed employer retirement match first. If your employer matches 5 percent of salary pound-for-pound or cedi-for-cedi, that is an instant 100 percent return before market compounding even starts.
- Hold a starter cash buffer for urgent surprises. Keeping one month of essential living expenses in an instant-access money market or savings account stops a flat tyre or clinic bill from forcing you back onto high-cost credit.
- Eliminate high-interest debt before investing heavily. Any debt charging more than roughly 8 to 10 percent APR (and certainly any overdraft, store card, or payday loan above 18 percent) beats the risk-adjusted return of public markets; paying it off is a guaranteed, tax-free equivalent return.
- Scale your emergency reserve and long-term compounding together. Once expensive debt is gone, build three to six months of liquid reserves while automating monthly contributions into low-fee long-term investments.
Reading your result sensibly and avoiding planning mistakes
A projection tool is most helpful when you treat its output as a stress-testing dashboard rather than a single fortune-telling number. Keeping five practical habits in mind prevents almost every mistake people make with compound interest calculators.
- Judge the plan by the interest-to-contribution ratio, not just the headline balance. Compare the Interest earned card against Total paid in. If interest is smaller than what you contributed, your plan is still mostly a savings effort — lengthening the horizon or cutting product fees will move the needle faster than squeezing small luxuries out of your budget. Once interest exceeds total cash paid in, compounding is carrying the heavier half of the load.
- Run a three-rate corridor every time. Never build a life plan around a single optimistic number. Run the form three times: a cautious net rate (say 5 percent), a central base case (7.5 percent), and an optimistic case (9.5 percent). If your child's tuition fund or retirement target only works when everything goes right at 9.5 percent, the plan is fragile; raise the monthly contribution now until the cautious case gets you close.
- Match nominal rates with nominal goals, or real rates with today's prices — never mix them. A common planning error is entering a high nominal yield (for example, 14 percent on local-currency bonds in an economy with 10 percent inflation) and then comparing the huge nominal result twenty years out against today's house prices or living expenses. Either deflate the interest rate using the Fisher formula so your final balance is expressed in today's money, or inflate your future target cost by expected annual inflation too.
- Check whether your bank already quoted APY. If a deposit product advertises "9.00% APY" or "9.00% Effective Annual Rate," intra-year compounding is already baked into that figure. Select Annually in the frequency dropdown when modelling an APY quote so you do not double-count monthly or daily compounding.
- Bring major plans to a licensed professional when stakes are high. When you are sizing a pension drawdown, locking up an inheritance, or committing to multi-year tax wrappers, bring your conservative and base-case printouts to a regulated, fee-transparent financial advisor in your jurisdiction. Running the scenarios yourself beforehand means you spend that appointment discussing tax rules, risk tolerance, and asset allocation rather than basic arithmetic.
Sources
- U.S. Securities and Exchange Commission. Compound Interest Calculator & Methodology. Investor.gov. investor.gov
- SEC Office of Investor Education and Advocacy. Compound Interest: Investor Bulletin. sec.gov
- FINRA Investor Education Foundation. Compound Interest: How Compounding Works & the Rule of 72. finra.org
- SEC Office of Investor Education and Advocacy. Updated Investor Bulletin: How Fees and Expenses Affect Your Investment Portfolio. sec.gov
- Consumer Financial Protection Bureau (CFPB). What Is the Difference Between a Loan Interest Rate, APR, and APY? consumerfinance.gov
- Organisation for Economic Co-operation and Development. OECD/INFE Core Competencies Framework on Financial Literacy. oecd.org